Net Promoter Score: Ultimate Guide to Know All About NPS
Who are promoters, detractors, and passives? What is the role of NPS in improving customer experience? How to calculate NPS? We are answering all the important NPS-related questions in this ultimate Net Promoter Score guide.

“On a scale of zero to 10, how likely are you to recommend [Company Name] to a friend or colleague?”
All of us have seen this question at least once in our inboxes. It could be from the car rental agency you just used or your internet security software company. Your answer to this question is the foundation of the Net Promoter Score, an authoritative, widely accepted gauge of customer satisfaction and customer experience.
First, a little bit of history. Fred Reichheld of Bain & Company was the first to introduce Net Promoter Score (NPS) in 2003. He wrote an article in Harvard Business Review titled, “The One Number You Need to Grow”. In the article, he outlined an approach that was unorthodox at that time.
In the early 2000s, customer surveys were a pain because they had dozens of questions, leading to meager response rates. The responses and the data were ambiguous at best and were not actionable. Technologies like Survey Analysis, NPS analytics, churn analysis, and customer satisfaction analysis to analyze and find insights from customer data were not hyped. Stakeholders were not concerned about these surveys because they did not correlate strongly with profits.
Reichheld changed all that with his one simple metric — the Net Promoter Score.
What is Net Promoter Score?
According to Bain & Company, the Net Promoter Score is a “reliable metric to link improvements in customer loyalty to business outcomes”.
It is a single, easy-to-understand customer satisfaction benchmark that predicts overall company growth and customer lifetime value. Improving this metric leads to profitable, sustainable, and organic growth.
In simple terms, the Net Promoter Score is the difference between the percentage of people who would recommend your product and the percentage of people who wouldn’t.
But why is Net Promoter Score based on the question, “Would you recommend?”, rather than another one like “Did you have a good experience”? Or “How satisfied are you with [company name]?”
Reichheld surveyed 4,000 customers who bought a product or service from different industries. He correlated the answers that customers gave for various questions and their behavior. He found a strong statistical correlation between the answer to the question, “Would you recommend our product” and repeat purchases or referrals.ƒ
This means that, even if customers thought the “service was good” or said that they were “satisfied” with a product, there was no guarantee that they would come back for another purchase or recommend it to someone else. However, the “would you recommend” question was an accurate indicator. And repeat business and recommendations are the biggest drivers of growth and profits, which means that this question assumes more importance.
He may not have realized it then, but Reichheld’s Net Promoter Score has accrued far more relevancy in today’s SaaS industry, where the subscription model rules the roost.
You want your customers to continue subscribing to your products and recommend you to other departments or organizations as well. When it comes to retaining subscribers, a good Net Promoter Score improves the chances of customer retention, especially for SaaS businesses.
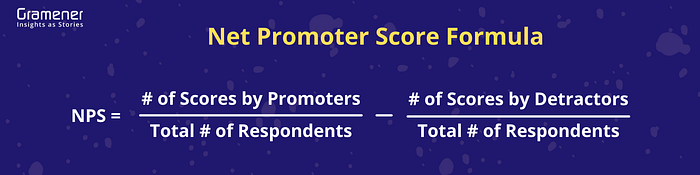
How to Calculate Net Promoter Score?
Since Net Promoter Score is based on a single, uncomplicated metric, it doesn’t involve complex calculations or functions. But before we dive into the NPS formula, we need to understand who are promoters, passives, and detractors. The NPS may be calculated by identifying client sentiments. As a result, the Net Promoter Score may be determined by a technique called customer sentiment analysis.
Reichheld and his team at Bain & Company came up with a simple 0–10 scale for capturing customer feedback. For the question, “How likely is it that you would recommend [company X] to a friend or colleague?”, a score of 0 meant “not at all likely”, while 5 meant neutral, and 10 meant “extremely likely”.
By undertaking customer surveys, they identified three logical clusters of customers. “Promoters” generally gave a rating of 9 or 10 (extremely likely to recommend the product to a friend or colleague). “Passive” customers usually gave 7 or 8. The “Detractors” assigned scores between 1 and 6.
Since it’s usually the promoters and detractors who are most likely to make a positive or negative impact, only they are factored in.
Now, let’s implement NPS Formula and try to understand how it works. Let’s assume that you run a car rental service. You surveyed 345 of your customers. The results are captured in the image below.
In the results above, you have 40 customers who gave scores of 0 to 6, which means you won’t be seeing any of their friends or colleagues soon. On the other hand, you have over 200 customers who gave you a score of 9 or 10. They are your champions, the customers who will remain loyal to you (at least for some time) and recommend your exceptional rental service to others.
Now, calculate the percentage of promoters (61.5%) and detractors (11.6%). The difference between the two (61.5–11.6) works out to about 50. This is your NPS score. As simple as that.
Your score will be -100 if all your customers are detractors (It’s probably a good idea to shut shop permanently) or 100 if your customers are all promoters (Kudos!)
Check out our latest guide if you want to know how to calculate NPS with MS Excel and Machine Learning model.
What is a Good Net Promoter Score?
Scores vary widely depending on several factors like industry, country, and demographics of your customers. Since this is bound to vary from company to company, one of the best ways to look at this is to better your scores from the previous quarter.
NICE Satmetrix, the company that helped Reichheld survey customers for his first NPS study, has a useful NPS chart according to the industry.
Department and Specialty stores seem to have the best scores, while Cable networks and Internet Service Providers languish at the bottom.
Brokerage, investment firms, and insurance companies, too, have above-average scores. Travel websites and software/apps have sub-par NPS scores on average.
According to Retently, the average NPS benchmark in 2020 for SaaS businesses was 30, while for enterprise software, this number was 44. Like NICE, Retently pegged the average NPS benchmark to be high for insurance companies.
Retently also estimated the average Net Promoter Score to be highest in the field of education and training.
When Should You Go for an NPS Survey?
There are usually two situations when you can trigger an NPS survey. One is transactional, and the other is relational. Let’s look at the difference between the two.
Transactional Net Promoter Score
These transactional surveys (t-NPS) are triggered immediately after every customer touchpoint. For instance, as soon as a customer makes a purchase. Or after a major product update or after customer care resolves an issue.
Transactional NPS is great for understanding a particular aspect of your business. Since the customer’s feedback is tied directly to that product or service, it’s easy to zero in on any defects or faults that might occur.
Relational Net Promoter Score
Relational surveys (r-NPS) are sent out periodically, like every quarter or half-yearly. These surveys help you understand what the business generally means to the customer and indicate the customer and the brand’s long-term relationship.
These surveys are essential from a strategic perspective as they provide a bird’s eye view into customer loyalty. As we’ve seen before, loyal customers are vital for business as they keep coming back and referring others.
How to Set Up an NPS Survey?
It’s generally best to immediately trigger the NPS question and in-app if the customer is using your app. For example, it could be, “Based on your ordering experience, how likely is it that you would recommend our food delivery service?”
You could also send an e-mail. However, a drawback of email is that response rates are much lower, and there’s no guarantee that the customer sees or opens your email.
Asking the NPS question through Internet messaging apps or text messages gives a more personalized nudge and is as simple as replying with a number. However, this channel is usually much more expensive than the others.
Another more expensive but ultra-personalized option is through a phone call. However, it’s best if these are reserved for r-NPS surveys, as using these for transactional surveys would seem like an intrusion into the customer’s personal space.
NPS Follow-up questions
Usually, the NPS consists of only one question about recommending your product or service to someone else. However, you can schedule a couple of follow-up questions to understand what you’re doing right and what you’re not.
Since the NPS surveys’ primary aim is to keep it short and simple, just one or two follow-ups work best.
If a customer says they wouldn’t recommend your product, the follow-up could be on the lines of what didn’t work for the customer. If the response was positive, the follow-up could ask what worked best.
Depending on the context, you can choose whether to keep the follow-up question open-ended or have multiple-choice answers.
Pros and Cons of NPS
Surveys have shown that NPS is strongly correlated with revenue growth. A London School of Economics study showed that every 7% increase in NPS resulted in a 1% growth in revenue. However, there are a few limitations with NPS as well. Let’s take a look at the pros and cons:
Advantages of NPS
- Simple metric, easy to implement
- Customer response rates are high due to the limited number of questions
- Can measure customer loyalty/satisfaction over time
- Easy to follow-up on detractors and find out what went wrong
- Can compare NPS score to the industry standard/norm
Drawbacks of NPS
- Doesn’t measure the why. Why would the customers not recommend your services? What should the company do to improve? NPS doesn’t answer these questions
- Not comprehensive, and often needs to be combined with another survey like a Voice of customer or CSAT to get thorough feedback
- Does not account for the influence factor of promoters or detractors. For instance, if you have a celebrity on your detractors’ list, it will be far more damaging.
Takeaways
The NPS system is the most widely used indicator of customer loyalty since its inception in 2003. It’s easy to set up, has high response rates, and delivers quick results that you can act on. It is also highly correlated with revenue growth.
At Gramener, we offer NPS Analytics Solutions to businesses. We work towards creating visual data applications to help executives understand their Net Promoter Score and utilize it to make data-driven decisions for improving customer experience.